Hello, I'm
Abdirahman Ali.
Senior Analytics Engineer. I build the infrastructure that turns raw data into decisions.

I'm a data professional with 5+ years of experience building analytics infrastructure at tech companies. My work spans the full stack: data modeling in dbt, warehouse design, and the pipelines connecting all of it.
Most of what I build ends up in the hands of non-technical teams. The goal is always the same: make it easy for people to answer their own questions, without filing a ticket and waiting a week.
Away from work, I'm deep in NBA statistics. Deep enough that I built a full data pipeline to analyze 70 years of player data. You can explore it below.
I'm also getting deeper into AI tooling. Looking to take on more projects with Claude Code and explore how it can be used to solve harder, more interesting problems.

NBA Analytics Pipeline
End-to-end data pipeline covering 70+ years of NBA history
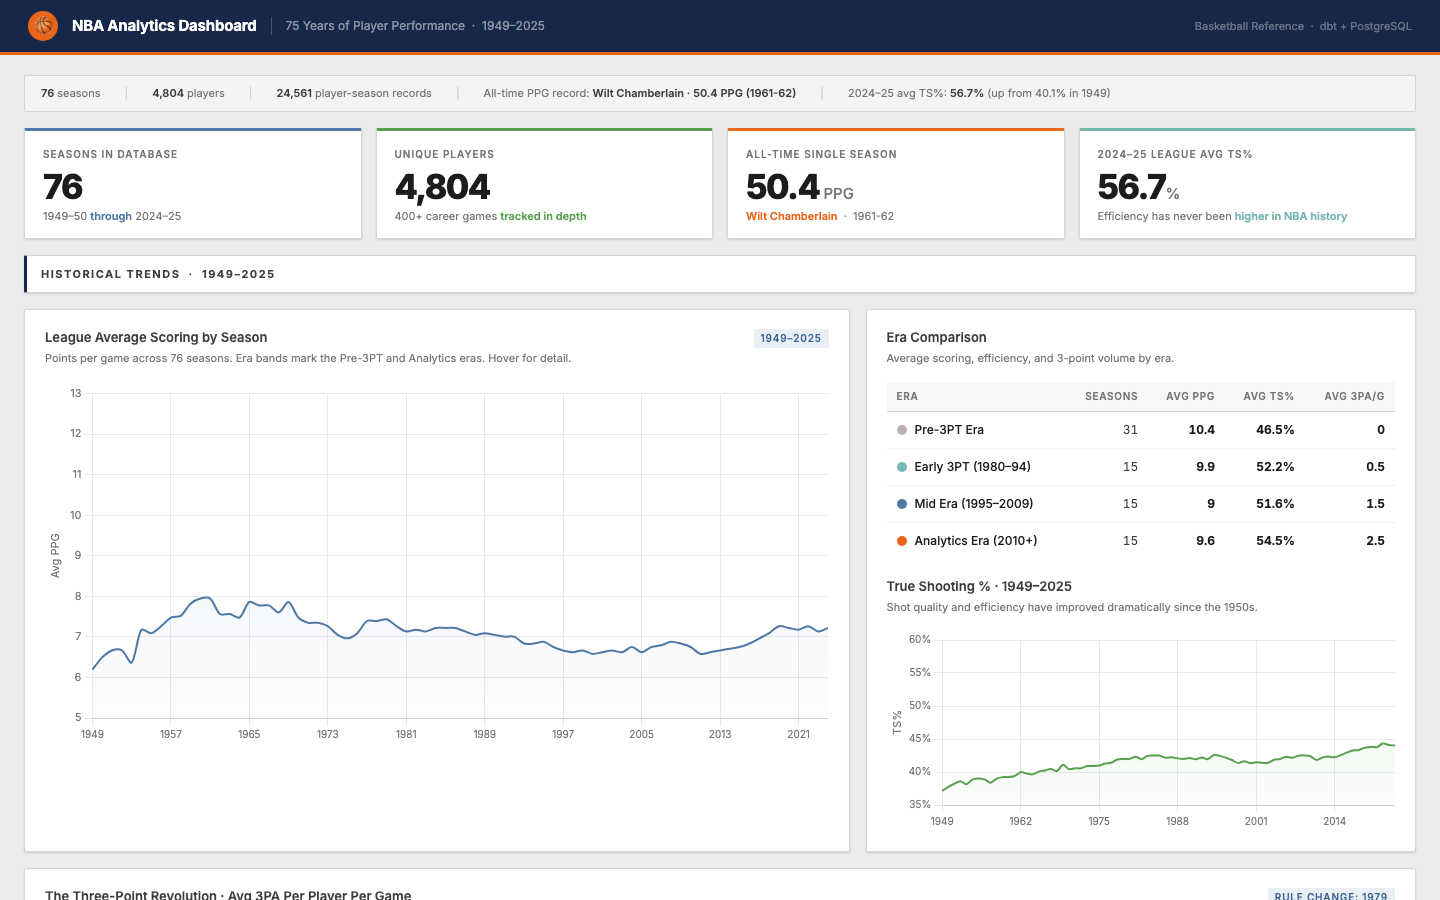
A dbt pipeline processing 70+ years of NBA stats through staging, intermediate, and mart layers. Calculates 15+ advanced metrics including True Shooting %, PER-36, and usage rates.
Toronto Parking Analytics
34.7M+ parking ticket records from 2006 to present
Ingests 34.7M+ Toronto parking tickets via the CKAN API into ClickHouse, transformed through a dbt medallion architecture with 19 tests.
Lead Pipeline
AI-powered B2B lead scoring and routing system
Modular lead pipeline: ingest via webhook or CSV, deduplicate, score with Claude AI, and route to reps. FastAPI backend with Neon Postgres and GitHub Actions automation.
Daily Job Listings Digest
Automated job scraping and email digest
Daily job digest via JSearch API — filtered by role and location, formatted and sent via Gmail SMTP.